Here’s a scenario that plays out every week in Amazon seller communities across the United States: a brand owner spends three months tightening their Advertising Cost of Sale down to a respectable 12%.
Their campaign manager looks clean. Their ROAS is up. Then they pull their monthly P&L and realize they’re still not profitable.
Sound familiar? The problem isn’t their bids. It’s their metric. ACoS and TACoS are two of the most important — and most misunderstood — numbers in Amazon advertising.
ACoS tells you how efficiently your ads convert ad spend into ad revenue.
TACoS tells you something far more powerful: how your advertising investment is contributing to your entire Amazon business, including organic sales.
Understanding ACoS vs TACoS, when to use each, and how to move them in the right direction is what separates sellers who scale from sellers who spin their wheels.
This guide by Brandock, experts in Amazon automation, gives you the complete framework.
Key promise: By the end of this guide, you’ll know exactly which metric to act on based on your product stage, category, and business goal — and you’ll never confuse a low ACoS for a profitable business again.
What Is ACoS? Definition, Formula, and What It Actually Measures
Advertising Cost of Sale (ACoS) is Amazon’s native metric for measuring ad efficiency at the campaign level. It answers one specific question: for every dollar of revenue generated through a sponsored ad, how many cents did you spend to get it?
The ACoS Formula
ACoS = (Ad Spend ÷ Ad Revenue) × 100
For example, if you spend $200 on Sponsored Products in a week and those ads directly generate $1,000 in sales, your ACoS is 20%.
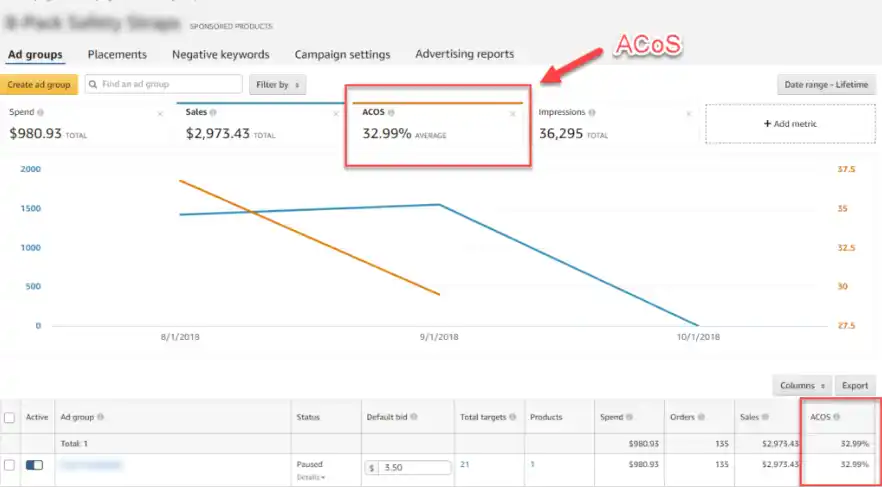
Amazon calculates and displays ACoS inside Seller Central’s Campaign Manager. It covers Sponsored Products, Sponsored Brands, and Sponsored Display. But crucially, only the revenue that Amazon can directly attribute to a paid click.
What ACoS Measures — and What It Deliberately Ignores
ACoS is a paid attribution metric. It only counts revenue traced to a sponsored click within Amazon’s attribution window (typically 7 days for Sponsored Products). This means ACoS completely ignores:
- Organic sales generated after a customer first discovered you through an ad
- Repeat purchases from customers who originally converted via a sponsored click
- Brand search volume lift driven by display or video campaigns
- Sales on product variants not directly advertised
This is not a flaw. ACoS is designed to measure campaign-level efficiency, and it does that well. The problem arises when sellers treat it as a measure of overall business health. That’s where TACoS comes in.
Moreover, your ad efficiency is only as strong as the quality of your Product description. Poor listings reduce conversion rates and inflate ACoS even with good traffic.
Break-Even ACoS: Your Personal Profitability Floor
Break-Even ACoS = Profit Margin (after COGS, FBA fees, and overheads) × 100
If your true margin after cost of goods, FBA fulfillment fees, referral fees, and operating overhead is 28%, your break-even ACoS is 28%.
Running campaigns above this number means you’re subsidizing growth out of pocket.
Running below it means each ad-driven sale remains profitable, unlike top-line revenue that can mislead sellers without healthy margins. That’s why understanding both revenue and profit is critical for long-term Amazon growth.
What Is TACoS? Definition, Formula, and Why It Tells a Different Story
Total Advertising Cost of Sale (TACoS) expands the lens.TACoS measures ad spend against total store revenue, not just ad-attributed sales.
For wholesale sellers, TACoS becomes even more important when scaling multiple approved wholesale brands and managing long-term profitability.
Lower Your TACoS and Grow Organically
Turn your ad spend into long-term organic revenue with a proven system.
The TACoS Formula
TACoS = (Ad Spend ÷ Total Revenue) × 100
Using the same example, you spend $200 on ads. Your ad-attributed revenue is $1,000 — but your total revenue for that period, including organic sales, is $3,500. Your ACoS is 20%, but your TACoS is 5.7%.
That gap between 20% and 5.7% isn’t noise. It’s a signal.
How to Find Total Revenue in Seller Central
Pull your total revenue from the Business Reports section in Seller Central — specifically the ‘Sales and Traffic by ASIN’ report. Add up ordered product sales across all ASINs for the period you’re analyzing. This includes organic and ad-attributed sales combined.
Reading TACoS Signals
- A falling TACoS alongside flat or steady ACoS means your organic sales are growing faster than your ad spend. Your ads are seeding organic rank, and your product is building momentum. This is the flywheel working.
- A rising TACoS with flat ACoS means your organic sales are declining relative to ad spend. Your paid sales may look stable, but the overall business is leaning harder on advertising to maintain revenue. It is a warning sign worth investigating.
- A rising ACoS with improving TACoS shows that paid ads are increasing visibility while organic sales maintain revenue. This approach is fine for launches or rank pushes, but unsustainable long-term without organic growth.
The ACoS–TACoS Gap
It may be the most useful calculation you add to your reporting stack this quarter.
ACoS–TACoS Gap = (ACoS − TACoS) ÷ ACoS × 100
This percentage tells you how organically self-sustaining your product is. A high gap means a large share of your revenue is coming from organic sales. A low gap means you’re almost entirely reliant on paid traffic.
Example: ACoS of 22%, TACoS of 6%. Gap = (22 − 6) ÷ 22 × 100 = 72.7%. Nearly three-quarters of your economic return from advertising is coming through organic channels. This product has earned its rank.
Example: ACoS of 20%, TACoS of 18%. Gap = 10%. Almost all revenue is ad-attributed. The product has not yet converted paid visibility into organic traction. Consider whether the listing, the reviews, or the BSR rank is the limiting factor.
Improving this gap is closely tied to how well your PPC campaigns are optimized and structured at the keyword and bid level.
Balance ACoS vs TACoS for Maximum Profit with Brandock
Get a complete strategy that optimizes both short-term efficiency and long-term growth.
The 2×2 Decision Matrix
| ACoS–TACoS Gap | What It Means for Strategy |
|---|---|
| Wide gap + improving trend | Organic growth is compounding. Maintain spend, protect rank. Harvest keywords. |
| Wide gap + declining trend | Organic was strong but is slipping. Investigate BSR, reviews, and listing quality. |
| Narrow gap + improving trend | The product is gaining early traction. Increase investment to accelerate the rank. |
| Narrow gap + declining trend | Reliance on paid traffic is growing. Diagnose listing CVR and organic rank urgently. |
Tracking this gap monthly in your Amazon account dashboard gives you a predictive signal. It’s not just a backward-looking report.
ACoS vs TACoS: Side-by-Side Comparison
| Dimension | ACoS vs TACoS |
|---|---|
| Formula | (Ad Spend ÷ Ad Revenue) × 100 vs (Ad Spend ÷ Total Revenue) × 100 |
| What it measures | Campaign efficiency vs Business health |
| Sales included | Ad-attributed only vs All sales (organic + paid) |
| Best for | Bid & keyword decisions vs Investment & growth decisions |
| Review frequency | Weekly (campaign level) vs Monthly/quarterly (business level) |
| "Good" value depends on | Your margin and campaign goal vs Your product stage and organic share |
The practical rule: use ACoS when you’re inside Seller Central, making bid adjustments. Use TACoS when you’re in a boardroom or investor call, explaining whether your Amazon business is growing efficiently.
What Is a Good ACoS? Setting Your Target by Business Stage
There is no universal ‘good’ ACoS. The correct target is a function of your margin, your growth objective, and the competitive intensity of your category. Here’s how to think about it:
Stage-Based ACoS Targets
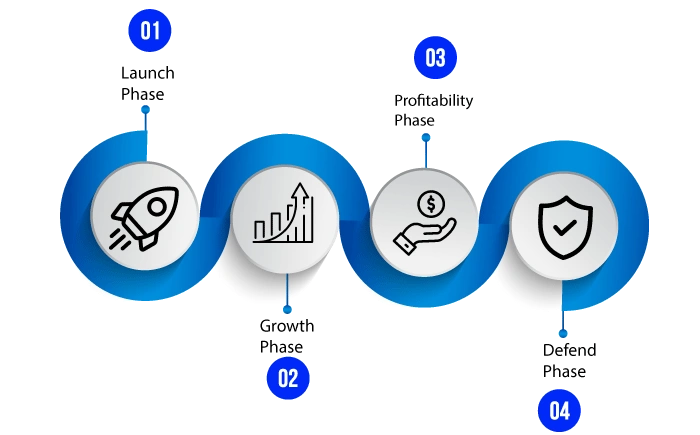
- Launch phase: ACoS up to 2× your break-even is acceptable. You are buying rank, reviews, and velocity — not profit. A 50% ACoS on a product with a 30% margin is a deliberate investment.
- Growth phase: ACoS should trend toward break-even as organic rank improves. Target 10–20% above your margin for moderately competitive categories.
- Profitability phase: ACoS at or below break-even. Every sponsored sale now contributes to net profit. Tighten bids on low-converting keywords and reallocate to your best performers.
- Defend phase: ACoS may need to rise temporarily if a competitor launches aggressively. You’re spending to protect the share, not to maximize short-term efficiency.
US Category ACoS Benchmarks (2026)
| Amazon Category | Typical ACoS Range |
|---|---|
| Electronics & Accessories | 8% – 15% |
| Health & Personal Care | 15% – 25% |
| Home & Kitchen | 18% – 28% |
| Beauty & Skincare | 20% – 35% |
| Sports & Outdoors | 14% – 22% |
| Pet Supplies | 18% – 30% |
| Supplements & Vitamins | 20% – 40% |
| Toys & Games | 15% – 25% |
What Is a Good TACoS? Benchmarks by Maturity Stage
TACoS without context is meaningless. A 15% TACoS for a product launched six weeks ago is excellent. A 15% TACoS for a mature top-10 bestseller is a red flag.
- Launch (0–3 months): TACoS of 15–25% is expected and healthy. You’re heavily dependent on paid traffic to build initial sales velocity.
- Growth (3–12 months): TACoS should be declining toward 8–15% as organic rank improves and organic sales increase their share of total revenue.
- Maturity (12+ months): TACoS of 4–8% is the hallmark of a well-ranked, organically strong product. Ads are supporting — not carrying — the business.
- The TACoS floor: Pushing TACoS below 3–4% often signals under-investment. You may be protecting short-term profit at the cost of rank defense and organic visibility. Competitors who keep spending will outrank you.
How TACoS Should Behave at Each Stage
- Launch: TACoS high and relatively stable — you’re building the machine.
- Early growth: TACoS begins to decline as organic rank improves. This is the inflection point — the moment organic sales start pulling their weight.
- Mid-growth: TACoS continues declining. The gap between your ACoS and TACoS widens. Your advertising flywheel is compounding.
- Maturity: TACoS stabilizes at a low level. A sudden rise here is a warning — check BSR, review velocity, and whether a competitor is outspending you for your core keywords.
- Decline: TACoS rises even as you maintain spending, because organic sales are falling. This signals a listing, pricing, or market-fit issue, not an advertising problem.
Practical tip: Set up a simple Google Sheet with weekly TACoS entries alongside BSR rank. A 12-week view of both columns tells a story no single dashboard metric can.
If your product listings on Amazon aren’t converting organic traffic, your TACoS will stall even with a perfect bidding strategy. Listing optimization and advertising are two sides of the same coin.
How Match Type and Ad Placement Affect Your Amazon’s Acoount ACoS
Looking at ACoS at the campaign level is like looking at your average body temperature across all your limbs. Technically accurate, practically useless. The insight is in the breakdown.
ACoS by Match Type
- Exact match ACoS tends to be lower — you’re bidding on high-intent, proven search terms. This is your efficiency engine.
- Broad match ACoS tends to be higher but serves a different purpose: discovery. You’re using broad match to find new converting search terms, which you then harvest into exact match campaigns.
- Phrase match ACoS sits in the middle — useful for capturing intent variations without the waste of pure broad match.
Running identical ACoS targets across all three match types is a common mistake. Your exact match campaigns should have the tightest ACoS targets. Your broad match campaigns need more breathing room — you’re paying for the discovery.
ACoS by Placement
- Top of search (first page): Typically higher ACoS, but higher conversion rate and better brand visibility. Worth the premium for rank-building keywords.
- Rest of search: Lower CPCs, lower visibility. Good for maintaining presence on long-tail keywords without overpaying.
- Product pages: Variable ACoS. Can be very efficient for defensive campaigns (bidding on your own ASINs) or offensive ones (appearing on competitor pages).
You can access placement-level ACoS data directly inside Seller Central:
Advertising → Campaign Manager → select a campaign → Placement tab. This data should be part of your weekly optimization review.
How Amazon Ads Create a Self-Sustaining TACoS Flywheel
On Amazon, advertising can permanently improve your organic position, and the compounding effect of that is what TACoS measures.
The Amazon Advertising Flywheel
- Step 1 — Ad spend generates sales velocity: Sponsored clicks drive conversions, which is precisely how Amazon PPC boosts both sales and visibility simultaneously. Amazon’s algorithm reads this velocity as a signal of product relevance and demand.
- Step 2 — Velocity improves BSR: Higher sales rank pushes your product higher in organic search results for your target keywords.
- Step 3 — Organic rank drives organic traffic: More organic visibility means more organic clicks and conversions without additional ad spend.
- Step 4 — Organic sales grow: Total revenue increases. Since ad spend stays constant but the denominator grows, TACoS falls.
- Step 5 — Lower TACoS = more capital for reinvestment: Efficient advertising frees up margin to reinvest in new products, more inventory, or A+ content.
Let Brandock Turn Ads Into Amazon Organic Sales
Use advertising to boost rankings and generate compounding organic revenue.
ACoS vs TACoS: How to Optimize Both
ACoS – Spend Smarter, Convert Better
- Move converting search terms to exact match; block non-converting terms.
- Adjust bids by placement; use dayparting for high-intent times.
- Improve listing CVR: optimize images, title, bullets, reviews, and A+ content.
TACoS – Grow Revenue Faster Than Spend
- Boost organic rank for top keywords; optimize listings fully.
- Increase revenue per ad: bundle products, Subscribe & Save, parent-child variations.
- Drive external traffic: email, influencers, Google Shopping (Brand Referral Bonus helps).
Key Idea: Even the best PPC strategy cannot fix weak listings—conversion optimization remains the foundation of long-term TACoS reduction.
ACoS vs TACoS in Automation Tools: Setting Guardrails That Respect Both
Rule-based and AI-driven Amazon bid automation tools — Perpetua, Pacvue, Scale Insights, Helium 10 Adtomic, and others — optimize toward ACoS by default.
The Core Problem
An automation rule set to ‘reduce bids when ACoS exceeds 30%’ will cut spend on keywords that are building BSR velocity. Even when the product’s TACoS signal says the flywheel is working. The tool is optimizing the wrong metric.
Practical Guardrails
- Set a minimum bid floor on your rank-building keywords — even if ACoS is above target, don’t let automation drop below a bid that keeps you visible for your 5 most important organic terms
- Create a TACoS review gate: before approving any automation recommendation that cuts total spend by more than 15%, review the rolling 90-day TACoS trend. Only approve cuts when TACoS is stable or declining
- Separate campaigns by purpose: run profit campaigns (tight ACoS targets, automation-led) and rank campaigns (TACoS-informed, manually controlled) as distinct campaign types with different rules
- Set portfolio budget minimums: automation should never reduce a portfolio’s weekly spend below the floor that sustained your current organic rank
At Brandock, our Amazon Ads Optimization framework always maintains human oversight over automation to catch the TACoS signals that rule-based tools miss.
This kind of transparent, data-driven approach is exactly what separates credible agencies from the growing wave of automated Amazon store scams that promise hands-free income but deliver no real performance accountability.
ACoS vs TACoS: Which Metric Matters More for US Amazon Sellers
The honest answer is: you should track both, always. But you should optimize one at a time, based on your current situation. Here’s how to decide:
By Product Stage
- Weeks 0–12 post-launch: Primary metric = TACoS. You want to see it declining over time. ACoS is secondary — high ACoS is acceptable if TACoS is trending down.
- Months 4–12 (growth phase): Both matter equally. TACoS should be your guardrail; ACoS should be your optimization target.
- Mature products: Primary metric = ACoS. Your organic base is established. Now extract maximum efficiency from every ad dollar.
By Business Goal
- Goal = scale fast: tolerate higher ACoS, watch TACoS as your compass
- Goal = maximize profit: tighten ACoS toward break-even, let TACoS validate organic health
- Goal = defend rank: watch both — rising ACoS with steady TACoS is acceptable; rising ACoS with rising TACoS is a crisis
By Reporting Audience
- Internal ops team / PPC manager: report weekly ACoS by campaign and match type
- Finance / ownership / investors: report monthly TACoS alongside total revenue trend and organic share of sales
The single-sentence rule: use ACoS to make bid decisions; use TACoS to make business decisions.
Where ROAS Fits In — and When to Use It Instead
ROAS — Return on Ad Spend — is the inverse of ACoS, expressed as a multiplier rather than a percentage. They contain identical information, just framed differently.
ROAS = Ad Revenue ÷ Ad Spend | ACoS = Ad Spend ÷ Ad Revenue × 100
A 20% ACoS equals a 5× ROAS. A 25% ACoS equals a 4× ROAS. Neither is more accurate — they’re two languages for the same data.
- Use ACoS when optimizing inside Amazon’s campaign manager. It’s the native metric, and it’s what Amazon’s bidding algorithms reference.
- Use ROAS when reporting to clients, leadership, or investors who come from Google Ads or Meta backgrounds. They think in multiples, not percentages.
- Total ROAS (TROAS) is the ROAS equivalent of TACoS — total revenue divided by ad spend. Useful for the same strategic conversations where TACoS applies.
How Brandock Helps You Optimize ACoS vs TACoS
At Brandock, we help US-based Amazon sellers optimize ACoS vs TACoS simultaneously
Key Services That Drive Results:
- Amazon Seller Account Creation – Fast, compliant account creation for smooth selling.
- Ongoing Amazon Store Support– Daily operations, inventory, and compliance management.
- Amazon PPC & Advertising Management – Campaign setup, bid automation, keyword mining, and ACoS optimization.
- FBA Product Sourcing Automation – Product sourcing, inventory control, and automation for hands-free growth.
- Amazon Listing Optimization – Optimized titles, bullets, and images for higher CTR and conversions.
- Amazon Brand Store Content Design – Enhanced brand content to boost CVR and organic rank.
- US LLC Registration Services – Legal entity setup for smooth US operations.
With Brandock, your campaigns become efficient. Your listings convert better. Your ad spend drives lasting organic growth. The result is a strong balance of ACoS vs TACoS.
FAQs: ACoS vs TACoS
Check ACoS weekly for bids. Review TACoS monthly (90-day trend) with BSR and organic sales. Daily TACoS is usually unnecessary.
Yes. Include all ad spend (Sponsored Products, Brands, Display, DSP, external traffic) to get an accurate TACoS.
ACoS is more relevant for campaign-level optimization. TACoS helps track overall ad dependency, but it is secondary.
No. TACoS includes total revenue, so it’s always equal to or lower than ACoS.
It should be at or below your profit margin, depending on your goals and growth stage.
ACoS vs TACoS: Final Verdict
ACoS vs TACoS aren’t competing. They complement each other. ACoS is your cockpit panel: precise, real-time, for day-to-day decisions. TACoS is your altitude gauge: it shows if your overall strategy is on track.
Successful US Amazon sellers use both: ACoS vs TACoS. ACoS to optimize campaigns weekly, and TACoS to ensure ads grow a self-sustaining organic business, not just a paid dependency.
Your next step: pull your TACoS for the last 90 days. If you can’t find it, calculate it from your Business Reports. Then chart it against your BSR rank. That single view will tell you more about your Amazon business health than any dashboard.
Optimize ACoS With Brandock Without Losing Sales
Lower wasted ad spend while maintaining strong conversion performance.
 Generating Millions in